×

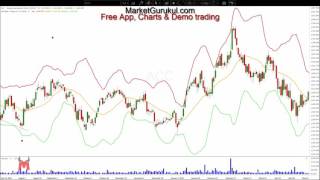
MarketGurukul's video: How to use Bollinger Bands in Trading Hindi Technical Anlaysis

@How to use Bollinger Bands in Trading Hindi Technical Anlaysis
Bollinger Bands can give clear indication about Trend reversals and strength of the trends. A very good tool based on Standard Deviation. Bollinger Bands, is given to us by John Bollinger and it is one of the most Popular Technical Analysis Indicator found almost in all popular charting tools. Bollinger band works on Simple moving average and Standard Deviation. The most used parameters are a 20 period SMA and 2 Standard Deviation. Bollinger bands is a very useful indicator to have in your trading tools. In this video Edward JI tries to explain the strength and limitation of Bollinger Bands, along with how to interpret them for your trading. Link to John Bollinger's Videos : https://www.youtube.com/watch?v=Em2ObWiiNSs https://www.youtube.com/watch?v=cq3gkwin1y4 http://www.marketgurukul.com http://www.marketgurukul.com/chart MarketGurukul Android App with 100+ Technical Analysis Videos for Indian Stock market https://play.google.com/store/apps/details?id=com.httpmetabulls.marketgurukul www.demotrading.in for demotrading in Indian Stocks.

5.2K

570
MarketGurukul
Subscribers
520K
Total Post
185
Total Views
4.3M
Avg. Views
75.1K
View Profile
This video was published on 2017-04-19 20:55:27 GMT by @MarketGurukul on Youtube. MarketGurukul has total 520K subscribers on Youtube and has a total of 185 video.This video has received 5.2K Likes which are higher than the average likes that MarketGurukul gets . @MarketGurukul receives an average views of 75.1K per video on Youtube.This video has received 570 comments which are higher than the average comments that MarketGurukul gets . Overall the views for this video was lower than the average for the profile.

Other post by @MarketGurukul