×

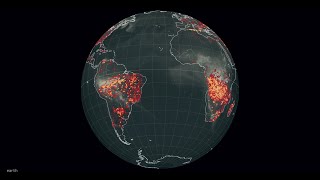
nullschool's video: seven month time lapse of CO2 surface concentration

@seven month time lapse of CO2 surface concentration
This animation shows a seven month time lapse animation of CO2 surface concentrations from July 2015 until Feb 2016. The data comes from NASA's GEOS-5 numerical weather model (http://gmao.gsfc.nasa.gov/GEOS). A few things to notice: 1. Look for the daily "heartbeat" caused by plants changing their CO2 absorption rates between daytime and nighttime. 2. As summer turns into fall, notice how concentrations increase in the northern hemisphere as trees lose their leaves. 3. Look for urban areas where the high population density results in easily visible plumes of CO2 emissions. Today's CO2 surface concentration: https://earth.nullschool.net/ /chem/surface/level/anim=off/overlay=co2sc/orthographic

60

5
nullschool
Subscribers
7.1K
Total Post
33
Total Views
222.6K
Avg. Views
6.7K
View Profile
This video was published on 2016-07-12 19:01:50 GMT by @nullschool on Youtube. nullschool has total 7.1K subscribers on Youtube and has a total of 33 video.This video has received 60 Likes which are lower than the average likes that nullschool gets . @nullschool receives an average views of 6.7K per video on Youtube.This video has received 5 comments which are lower than the average comments that nullschool gets . Overall the views for this video was lower than the average for the profile.nullschool #current/chem/surface/level/anim=off/overlay=co2sc/orthographic has been used frequently in this Post.

Other post by @nullschool