×

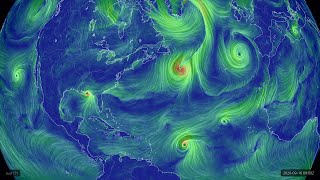
nullschool's video: one year time lapse of the 2015-2016 El Ni o event

@one year time lapse of the 2015-2016 El Niño event
This time lapse animation shows Sea Surface Temperature Anomaly (SSTA) covering a period from April 2015 until mid-June 2016. El Niño development is clearly visible along the equator, peaking around mid-Nov 2015. The rebound back to cooler temperatures in June foreshadows a corresponding La Niña event. For more information, see https://www.climate.gov/news-features/blogs/enso/june-enso-discussion-new-neutral. In this animation, it's also possible to see typhoon tracks in the Western Pacific between July and September 2015. Typhoons suck up heat from the ocean and pump that energy into the atmosphere. As a result, they leave tracks of unusually cool water visible in the SSTA data. But don't blink! Each track is visible for only a fraction of a second. Sea surface temperature data comes from the Marine Modeling and Analysis Branch / EMC / NCEP / NWS / NOAA (http://polar.ncep.noaa.gov). SSTA calculations and rendering are by https://earth.nullschool.net using 1981-2011 climatology provided by MMAB.

28

8
nullschool
Subscribers
7.1K
Total Post
33
Total Views
228K
Avg. Views
6.9K
View Profile
This video was published on 2016-07-12 18:42:55 GMT by @nullschool on Youtube. nullschool has total 7.1K subscribers on Youtube and has a total of 33 video.This video has received 28 Likes which are lower than the average likes that nullschool gets . @nullschool receives an average views of 6.9K per video on Youtube.This video has received 8 comments which are higher than the average comments that nullschool gets . Overall the views for this video was lower than the average for the profile.

Other post by @nullschool